Table of Contents
- Why Mapping Twitter Audience Locations Matters for Local Marketing
- Followerwonk: Detailed Audience Location Analysis
- SparkToro for Audience Geography and Demographics Overlap
- Audiense: Advanced Segmentation and Geo-Targeting
- Talkwalker for Large-Scale Geolocation Tracking
- Brandwatch Analytics and Real-Time Geographical Dashboards
- Sprout Social: Built-In Location Reporting
- Tweepi for Actionable Follower Location Exports
- Twitter Analytics: Free Native Geo Data
- Socialbakers (Emplifi) Geographic Benchmarking
- Hootsuite Insights Powered by Brandwatch for Global Teams
- Comparing Tools for Twitter Audience Geographical Distribution Maps
- Integrating Geographical Audience Insights into AI Marketing Campaigns
Why Mapping Twitter Audience Locations Matters for Local Marketing
A twitter audience geographical distribution map can visualize follower clusters on a map based on their regional affiliation, town or city, as well as which district they inhabit. It will provide companies with information that allows them to produce different content for each region, place in advertising to only the appropriate urban areas, and distribute local discounts. As required by X’s Developer Platform, location data uses user opt-in and place_id, not raw coordinates, so mapping must respect these boundaries while still extracting useful insights. Still, however, to turn that overview into precise campaign segments, businesses need specialized analytics that deliver granular detail.
Having established the value of geographic audience mapping, we now turn to one of the most direct tools: Followerwonk’s location analysis. In the Audience tab, the tool allows you to select 'Location', which breaks followers down by country, region, or city. It will then present that info via an interactive map or as a list of ranked places where followers have concentrated most densely. By drilling into these locations you can figure out what they look like. They provide you with some information about those regions, and once you pair it up with demographic overlay tools it creates a bigger picture.
Key Takeaways
- SparkToro allows users to see where their target audience overlaps, while Audiense takes things even further through advanced segmentation and geotargeting geared specifically towards Twitter.
- After segmenting audiences by behavior and interests, it becomes important to understand where they are physically located.
- Brandwatch provides a real-time geographical dashboard that visualizes audience locations on Twitter (X) through interactive maps.
- Sprout Social’s built-in location reporting helps you visualize the twitter audience geographical distribution map within its analytics dashboard.
- Sprout Social provides native location based reporting while Tweepi offers another option which enables users to export the raw data from their follower locations in order to analyze this data themselves.
SparkToro for Audience Geography and Demographics Overlap
While FollowerWonk delivers granular location information on its followers, SparkToro takes the long view in two ways: considering geography when looking at the overlap between its own audience and that of competitors, and using the same metadata and engagement signal-based techniques to locate people’s geographies and to map their demographics to regions, which lets you see where they live. It also shows how much of each competitor’s audience overlaps with yours, expressed as a percentage.
A marketer might also be able to see how his own fans are distributed across different regions, compared to a competitor’s distribution. The next step for more segmentation and targeting involves a set of fine-grained controls.
Audiense: Advanced Segmentation and Geo-Targeting
SparkToro allows users to see where their target audience overlaps, while Audiense takes things even further through advanced segmentation and geotargeting geared specifically towards Twitter. With Audiense, researchers can segment out Twitter audiences based on locations and demographics, helping them create more tailored segments and discover where each group clusters. This kind of geo-targeting means that researchers can zoom into particular cities, regions, or other country-level areas to get a more fine-grained look at the kinds of people who make up their audience there. While Talkwalker’s monitoring capabilities allow for more sweeping geographic coverage, Audiense’s focus on granular segmentation makes it a useful addition when it comes to better understanding audiences from a geographic and interest standpoint on Twitter.
Talkwalker for Large-Scale Geolocation Tracking
After segmenting audiences by behavior and interests, it becomes important to understand where they are physically located. Large-scale geolocation tracking analyzes location data from millions of geotagged social media posts to map the geographic distribution of followers, revealing regional trends and cultural clusters. Platforms like Talkwalker enable you to analyze Twitter audience geography without manual sifting, offering heatmaps that surface language concentrations. This layer of insight scales audience understanding from individual segments to global patterns. Understanding these large-scale patterns prepares the ground for dashboards that visualize geographical data in real time.
Brandwatch Analytics and Real-Time Geographical Dashboards
Brandwatch provides a real-time geographical dashboard that visualizes audience locations on Twitter (X) through interactive maps. Users can filter the map across regions, by time period, and other parameters to pinpoint conversation concentrations, while the dashboard updates continuously to reflect current activity. This dynamic approach offers greater customization than static reporting features found in other platforms, making it a flexible option for tracking the geographical distribution of conversations, and it supports layered heatmaps and clustering to surface localized trends for faster situational awareness and targeted local engagement.
Sprout Social: Built-In Location Reporting
Sprout Social’s built-in location reporting helps you visualize the twitter audience geographical distribution map within its analytics dashboard. While Brandwatch provides real-time dashboards, Sprout Social offers a more streamlined location report integrated into its profiles analytics.
The Location tab inside of the Profiles Report will show you follower locations within an interactive map as well as in a ranked table. It allows you to see data about a single user or compare two or more against each other. This is also filterable by a date range and can be exported for further analysis allowing you to examine your audience’s distribution between various cities, states or even countries. Users that need to export their follower locations will find a useful option offered by Tweepi.
Tweepi for Actionable Follower Location Exports
Sprout Social provides native location based reporting while Tweepi offers another option which enables users to export the raw data from their follower locations in order to analyze this data themselves. We feel that we have greater freedom because using this method will mean we have complete control over filtering our audience, and feeding this information directly into our Twitter audience geographical distribution map with ease without being limited to any specific platform.
After downloading a location-filtered list, you can combine it with other data to visualize regional patterns. While Tweepi provides exportable intelligence, we tend to refer users towards Twitter Analytics as a free, native alternative for gathering geo insights directly from the platform.
Twitter Analytics: Free Native Geo Data
As opposed to third party exports which acquire locations via their users' profile information, the twitter audience geographical distribution map on X Analytics uses locations as specified in posts by tagging places. X employs place_id objects rather than lat/long coordinates when doing this, thereby restricting accuracy to the city or neighbourhood levels.
Users need permission before they can add their locations to posts, per X Developer Platform rules. Developers aren’t allowed to save this kind of geodata separately from where someone posted it on a public map. If people remove location info on a post, that needs to be updated on the map as well. So the distribution maps only show how people have been using them to make content, not what areas people may actually live in.
The result is a snapshot of audiences.
Socialbakers (Emplifi) Geographic Benchmarking
Socialbakers, now known as Emplifi, features Geographic Benchmarking, which allows users to see how their accounts’ follower base compares across regions, countries, and cities. Users can see the granularity down to locations which isn’t possible through Twitter’s analytics tool. Their dashboard maps out locations using heat map and density graphs for visualizing more areas people tend to congregate at instead of relying on geotagging alone. Having this type of information helps companies plan content better based upon location or help them focus campaigns more efficiently if they have local audiences. Also, some companies may be looking for tools like Emplifi that provide social media data and also tools needed to work with colleagues to listen to the conversation online in order to analyze what’s happening throughout all areas of business.
Hootsuite Insights Powered by Brandwatch for Global Teams
Hootsuite Insights powered by Brandwatch is a social listening tool which uses Brandwatch technology to give you access to Twitter audience geographic data. It lets you see where your followers cluster based on their location in various countries, states and city/townships. Global organizations might want this because it means they could publish tailored content per region, execute focused regional campaign efforts without guesswork, and ensure each region acts on reliable location insights. In our evaluation of tools for understanding audience geography, we consider Hootsuite Insights alongside other mapping solutions so you can select the best fit for visualizing your Twitter community's distribution. We include it as part of our broader comparison of audience geography mapping solutions.
Comparing Tools for Twitter Audience Geographical Distribution Maps
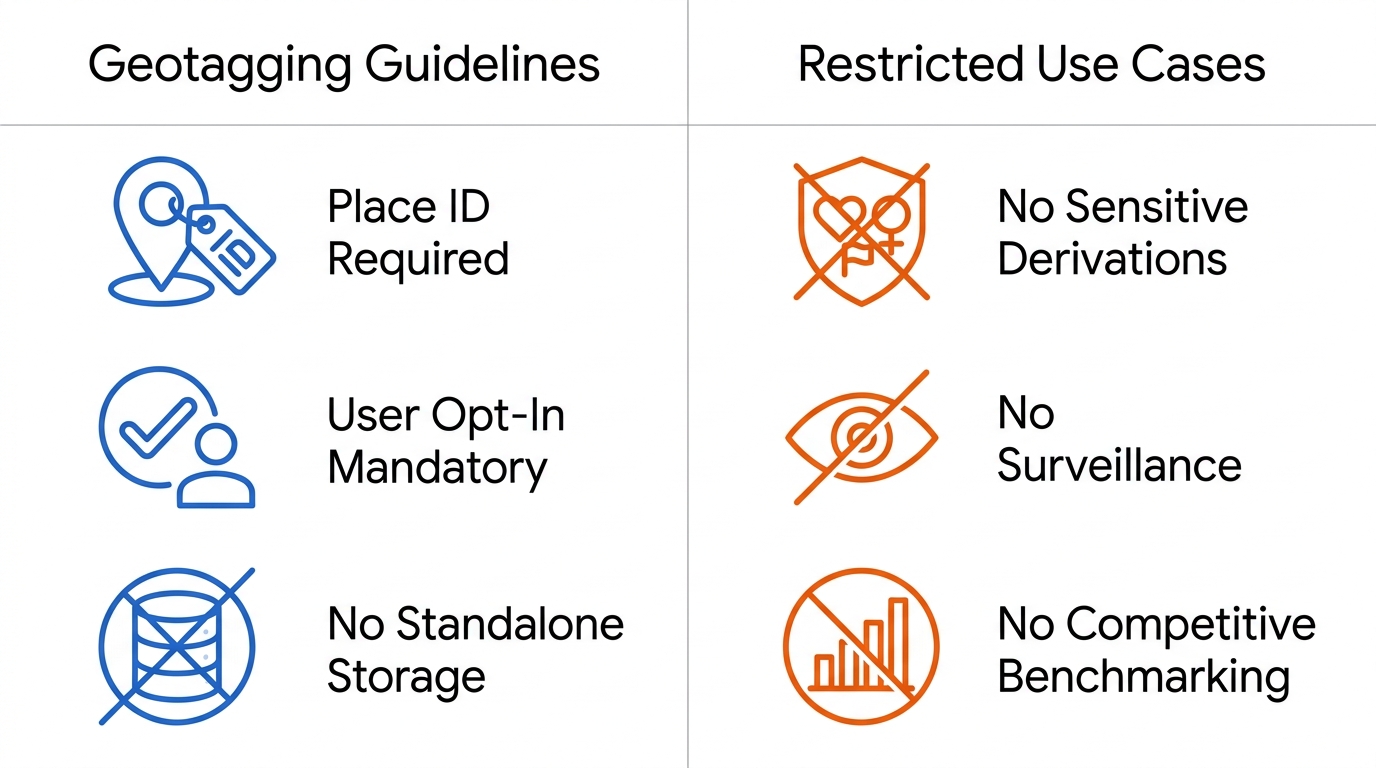
For any tool like Hootsuite Insights by Brandwatch which manages twitter audience geographical distribution map on X need to follow X API Geotagging Guidelines & Restricted Use cases : -Geotagging needs to be opted in by the users for each of their posts; only place_id can be used instead of raw latitude and longitude coordinates; Developers cannot store, aggregate, or cache location data beyond the content of individual tweets, And restricted use cases prohibit inferring sensitive personal attributes or characteristics, tracking individuals through surveillance, and using aggregated data to conduct competitive benchmarking.
| Tool | Best For | Pricing Model | Key Features | Pros | Cons |
|---|---|---|---|---|---|
| X API Geotagging Guidelines | Ensuring user consent for location data | Free (API tier) | User opt-in required, place_id only, no standalone storage | Clear privacy rules for developers | Limits raw coordinate use |
| X API Restricted Use Cases | Preventing profiling and surveillance | Free (API tier) | No sensitive derivations, no competitive benchmarking | Protects user privacy | Restricts aggregate audience analysis |
We have to follow opt-in consent and no-aggregation rules when we want to incorporate geographic data from audiences in our marketing programs using AI.
FAQ
How can I visualize the geographical distribution of my Twitter audience on a map?
You can visualize the geographical distribution of your Twitter audience using tools like Followerwonk, Sprout Social, Brandwatch, and Twitter Analytics. Followerwonk displays an interactive map and ranked locations, Sprout Social offers a location tab in its profiles report, and Brandwatch provides a real-time dashboard that updates continuously to show conversation clusters by region.
Why is mapping the location of my Twitter followers important for local marketing strategies?
Mapping follower locations helps you tailor content for each region, target advertising to specific urban areas, and distribute local discounts. It reveals where audiences cluster, allowing you to allocate marketing resources more effectively and adapt strategies to regional cultural or linguistic differences.
What are the best tools to export and map Twitter audience location data for business intelligence?
Tweepi lets you export raw follower location data so you can analyze and map it independently. Sprout Social also provides exportable location reports from its interactive map and ranked tables, enabling you to combine the data with other sources for business intelligence.
Can I use geographical audience data to improve the targeting of my AI-powered marketing campaigns?
You can use geographical audience data to improve AI-powered marketing targeting if you comply with X API guidelines. Users must opt in to location sharing, you cannot store location data separately from posts or infer sensitive traits, and all AI-generated insights should be verified before publishing.
How does identifying audience location help in optimizing content for global or multi-location brands?
Identifying audience location lets global brands publish tailored content for each region, run focused campaigns based on reliable location insights, and avoid guesswork. This helps align content with local cultural contexts and optimize engagement across different markets.
Integrating Geographical Audience Insights into AI Marketing Campaigns
Before making a Twitter audience geographical distribution map, you must get users' opt-in to access locations, cannot save locations without consent, and must not derive sensitive traits, spy on protests, or compare users to others. Verify all AI-generated insights before publishing them; our platform is provided as is and as available, offers no professional advice, outcomes are not guaranteed, and crypto features involve risk.
Track Your AI Visibility Today
You’ve now explored a range of tools for mapping your Twitter audience geographical distribution—from Followerwonk’s location breakdown to Brandwatch’s real-time dashboards. The next step is to ensure those geographic insights translate into real visibility when potential customers search with AI. Hashtag.org’s AI Visibility platform monitors your brand’s presence across seven major AI answer engines, using geo-specific queries to reveal how visible you are in your target locations. This insight lets you see where your brand is gaining traction and where it’s falling short, without any heavy lifting upfront. The platform’s approach is built around observation first, so you can make informed decisions before committing to optimization. Take the guesswork out of your AI-driven marketing and start monitoring your brand’s presence in the AI answers that matter most. See how your business stacks up in your target regions today.
Track Your AI Visibility Today